形状是WPF另一大系列控件。WPF所有的形状都继承于Shape基类。那么,WPF提供了哪些可用的形状呢?我们用一张图来说明它的子类。
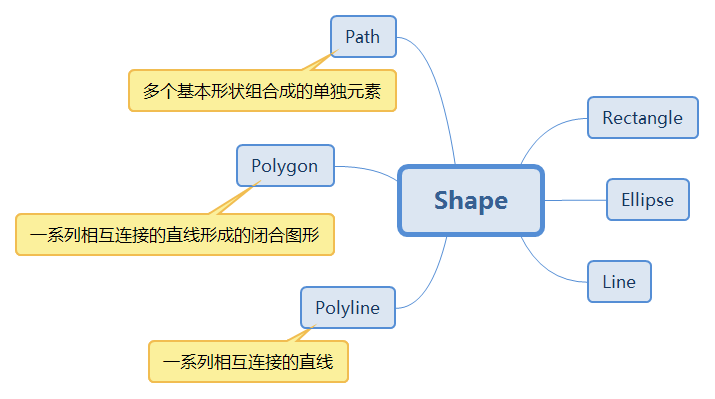
| 形状名称 | 说明 |
| Ellipse | 椭圆形 |
| Line | 在两个点之间绘制直线。 |
| Rectangle | 绘制矩形。 |
| Polyline | 绘制一系列相互连接的直线。 |
| Polygon | 绘制多边形,它是由一系列相互连接的线条构成的闭合形状。 |
| Path | 绘制一系列相互连接的直线和曲线。 |
Shape是一个抽象基类,它不能被实例化,所以我们在使用时只能实例化它的子类。而Shape的父类是FrameworkElement,所以,所有的Shape子类都是一个UIElement 类,因此形状对象可以用在面板和大多数控件中。 由于 Canvas 面板支持其子对象的绝对位置,因此特别适合创建复杂的图形。
我们来看看Shape的定义
一、Shape的定义
public abstract class Shape : FrameworkElement
{
    public static readonly DependencyProperty StretchProperty;
    public static readonly DependencyProperty StrokeDashArrayProperty;
    public static readonly DependencyProperty StrokeDashOffsetProperty;
    public static readonly DependencyProperty StrokeLineJoinProperty;
    public static readonly DependencyProperty StrokeDashCapProperty;
    public static readonly DependencyProperty StrokeMiterLimitProperty;
    public static readonly DependencyProperty StrokeStartLineCapProperty;
    public static readonly DependencyProperty StrokeThicknessProperty;
    public static readonly DependencyProperty StrokeProperty;
    public static readonly DependencyProperty FillProperty;
    public static readonly DependencyProperty StrokeEndLineCapProperty;

    protected Shape();

    public Brush Stroke { get; set; }
    public PenLineCap StrokeEndLineCap { get; set; }
    public PenLineCap StrokeStartLineCap { get; set; }
    public double StrokeThickness { get; set; }
    public Brush Fill { get; set; }
    public double StrokeDashOffset { get; set; }
    public virtual Geometry RenderedGeometry { get; }
    public Stretch Stretch { get; set; }
    public DoubleCollection StrokeDashArray { get; set; }
    public double StrokeMiterLimit { get; set; }
    public PenLineCap StrokeDashCap { get; set; }
    public virtual Transform GeometryTransform { get; }
    public PenLineJoin StrokeLineJoin { get; set; }
    protected abstract Geometry DefiningGeometry { get; }

    protected override Size ArrangeOverride(Size finalSize);
    protected override Size MeasureOverride(Size constraint);
    protected override void OnRender(DrawingContext drawingContext);

}
Shape基类提供了许多公共属性,如下表所示。
二、属性成员
| 属性名称 | 说明 |
| Stroke | 获取或设置Shape的边框颜色画刷 |
| StrokeEndLineCap | 获取或设置Shape描述线的末端的样式 |
| StrokeStartLineCap | 获取或设置Shape描述线的开头的样式 |
| StrokeThickness | 获取或设置Shape边框的厚度 |
| Fill | 获取或设置Shape的内部填充颜色 |
| StrokeDashOffset | 获取或设置短划线模式内短划线开始处的距离 |
| RenderedGeometry | 获取或设置Shape的几何 |
| Stretch | 获取或设置Shape的填充模式 |
| StrokeDashArray | 获取或设置勾勒形状轮廓的短划线和间隙的模式的值 |
| StrokeMiterLimit | 获取或设置一个限制到一半的斜接长度比 |
| StrokeDashCap | 获取或设置 System.Windows.Media.PenLineCap 枚举值,该值指定如何绘制虚线的末端。 |
| GeometryTransform | 获取或设置Shape的转换 |
| StrokeLineJoin | 获取或设置Shape的顶点处使用的联接类型。 |
| DefiningGeometry | 获取Shape的Geometry |
Ellipse继承于Shape,Shape继承于FrameworkElement,所以,它可以设置其 Width 和 Height。 使用其 Fill 属性指定用于绘制椭圆形内部的 Brush。 使用其 Stroke 属性指定用于绘制椭圆形轮廓的 Brush。 StrokeThickness 属性指定椭圆形轮廓的粗细。
下面的示例演示了椭圆和正圆。
前端代码
<Window x:Class="HelloWorld.MainWindow"
        xmlns="http://schemas.microsoft.com/winfx/2006/xaml/presentation"
        xmlns:x="http://schemas.microsoft.com/winfx/2006/xaml"
        xmlns:d="http://schemas.microsoft.com/expression/blend/2008"
        xmlns:mc="http://schemas.openxmlformats.org/markup-compatibility/2006"
        xmlns:local="clr-namespace:HelloWorld"
        mc:Ignorable="d"
        Title="WPF中文网 - wpfsoft.com - 椭圆课程" Height="350" Width="500">
    <Grid>
        <Grid.ColumnDefinitions>
            <ColumnDefinition/>
            <ColumnDefinition/>
        </Grid.ColumnDefinitions>
        <Ellipse Width="100"
                 Height="50"
                 Stroke="Black"
                 StrokeThickness="2"
                 Fill="Red">
            <Ellipse.Triggers>
                <EventTrigger RoutedEvent="Loaded">
                    <BeginStoryboard>
                        <Storyboard>
                            <DoubleAnimation From="100"
                                             To="200"
                                             Duration="0:0:2"
                                             AutoReverse="True"
                                             RepeatBehavior="Forever"
                                             Storyboard.TargetProperty="(Ellipse.Width)" />
                            <DoubleAnimation From="50"
                                             To="100"
                                             Duration="0:0:2"
                                             AutoReverse="True"
                                             RepeatBehavior="Forever"
                                             Storyboard.TargetProperty="(Ellipse.Height)" />
                        </Storyboard>
                    </BeginStoryboard>
                </EventTrigger>
            </Ellipse.Triggers>
        </Ellipse>
        <Grid Grid.Column="1">
            <Grid.RowDefinitions>
                <RowDefinition/>
                <RowDefinition Height="auto"/>
            </Grid.RowDefinitions>
            <Ellipse Width="{Binding ElementName=slider,Path=Value}"
                     Height="{Binding ElementName=slider,Path=Value}"
                     Fill="Green"/>
            <Slider x:Name="slider" Grid.Row="1" Value="50" Maximum="200"/>
        </Grid>
    </Grid>
</Window>
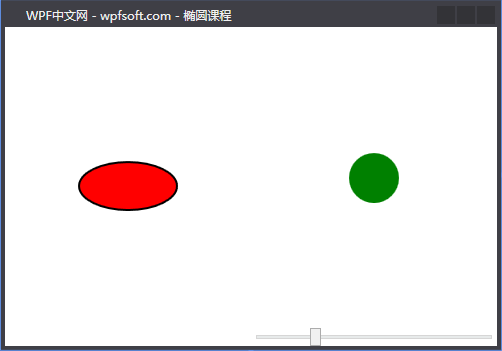
在上面的例子中,我们实例化了两个椭圆,第一个椭圆用了一个事件Triggers和Storyboard故事板,演示了椭圆大小的动画改变,在第二个椭圆中,宽度和高度相等,便出现了一个正圆,利用Binding对象将Slider的Value和椭圆的尺寸绑定起来,以此滑动改变椭圆大小。
注:关于动画部分,我们将在后面专门讲解。
当前课程源码下载:(注明:本站所有源代码请按标题搜索)
文件名:078-《Ellipse椭圆》-源代码
链接:https://pan.baidu.com/s/1yu-q4tUtl0poLVgmcMfgBA
提取码:wpff
——重庆教主 2023年10月17日
Line(线段)继承于Shape,它自身只有4个属性,分别用于定义线段两端的端点坐标。
public sealed class Line : Shape
{
    public static readonly DependencyProperty X1Property;
    public static readonly DependencyProperty Y1Property;
    public static readonly DependencyProperty X2Property;
    public static readonly DependencyProperty Y2Property;

    public Line();

    public double X1 { get; set; }
    public double Y1 { get; set; }
    public double X2 { get; set; }
    public double Y2 { get; set; }
    protected override Geometry DefiningGeometry { get; }
}
其中X1,Y1表示第一个点坐标,X2,Y2表示第二个点坐标。
下面的属性位于Shape基类,在Line线段中设置后,会有意想不到的效果。
StrokeStartLineCap属性:表示线段前头的开关。
Stroke:线条颜色。
StrokeThickness:线条宽度。
StrokeDashArray:设置虚线。
StrokeDashOffset:虚线位置偏移量。
接下来,我们以一个示例来说明Line的用法。
前端代码
<Window x:Class="HelloWorld.MainWindow"
        xmlns="http://schemas.microsoft.com/winfx/2006/xaml/presentation"
        xmlns:x="http://schemas.microsoft.com/winfx/2006/xaml"
        xmlns:d="http://schemas.microsoft.com/expression/blend/2008"
        xmlns:mc="http://schemas.openxmlformats.org/markup-compatibility/2006"
        xmlns:local="clr-namespace:HelloWorld"
        mc:Ignorable="d"
        Title="WPF中文网 - wpfsoft.com - Line课程" Height="350" Width="500">
    <Canvas x:Name="canvas">
        <Line x:Name="flowLine"
              X1="20"
              Y1="40"
              X2="400"
              Y2="100"
              StrokeDashArray="2,1"
              Stroke="Green"
              StrokeThickness="8"/>
        <Line X1="{Binding ElementName=x1,Path=Value}"
              Y1="{Binding ElementName=y1,Path=Value}"
              X2="{Binding ElementName=x2,Path=Value}"
              Y2="{Binding ElementName=y2,Path=Value}"
              StrokeStartLineCap="Round"
              Stroke="Red"
              StrokeThickness="5"/>
        <Slider x:Name="x1"
                Value="10"
                Maximum="450"
                Width="450"
                Canvas.Left="10"
                Canvas.Top="237"/>
        <Slider x:Name="y1"
                Value="10"
                Maximum="450"
                Width="450"
                Canvas.Left="10"
                Canvas.Top="256"/>
        <Slider x:Name="x2"
                Value="300"
                Maximum="450"
                Width="450"
                Canvas.Left="10"
                Canvas.Top="276"/>
        <Slider x:Name="y2"
                Value="300"
                Maximum="450"
                Width="450"
                Canvas.Left="10"
                Canvas.Top="295"/>
    </Canvas>
</Window>
后端代码
public partial class MainWindow : Window
{
    public MainWindow()
    {
        InitializeComponent();

        Loaded += (s, e) =>
        {
            int number = 10;
            Task.Run(() =>
            {
                while (true)
                {
                    if (number == 1)
                        number = 10;
                    Application.Current.Dispatcher.BeginInvoke(new Action(() =>
                    {
                        flowLine.StrokeDashOffset = number;
                    }));
                    number--;
                    Thread.Sleep(250);
                }
            });
        };
    }
}
在XAML代码中,我们实例化了两个Line,其中一个Line的端点坐标绑定了4个Slider的Value属性,可以通过滑动改变线条的位置,第二Line设置为虚线,并通过C#代码开辟子线程,在子线程中通过动态设置StrokeDashOffset属性,来模拟流动的线段效果。

当前课程源码下载:(注明:本站所有源代码请按标题搜索)
文件名:079-《Line线段》-源代码
链接:https://pan.baidu.com/s/1yu-q4tUtl0poLVgmcMfgBA
提取码:wpff
——重庆教主 2023年10月17日
Rectangle是一个比较简单而实用的图形控件,继承于Shape,有两个属性比较常用,即RadiusX和RadiusY,表示设置矩形的圆角。所以,通过这两个属性的设置,矩形也可以画出一个圆。
观察下面的例子。
<Window x:Class="HelloWorld.MainWindow"
        xmlns="http://schemas.microsoft.com/winfx/2006/xaml/presentation"
        xmlns:x="http://schemas.microsoft.com/winfx/2006/xaml"
        xmlns:d="http://schemas.microsoft.com/expression/blend/2008"
        xmlns:mc="http://schemas.openxmlformats.org/markup-compatibility/2006"
        xmlns:local="clr-namespace:HelloWorld"
        mc:Ignorable="d"
        Title="WPF中文网 - wpfsoft.com -课程" Height="350" Width="500">
    <Canvas x:Name="canvas">
        <Rectangle RadiusX="{Binding ElementName=slider,Path=Value}"
                   RadiusY="{Binding ElementName=slider,Path=Value}"
                   Width="{Binding ElementName=slider,Path=Value}"
                   Height="{Binding ElementName=slider,Path=Value}"
                   Fill="Red"
                   Canvas.Left="50"
                   Canvas.Top="36"/>

        <Rectangle Width="100"
                   Height="100"
                   Fill="Green"
                   Canvas.Left="313"
                   Canvas.Top="36"/>

        <Slider x:Name="slider"
                Width="450"
                Value="100"
                Maximum="450"
                Canvas.Left="32"
                Canvas.Top="291"/>
    </Canvas>
</Window>
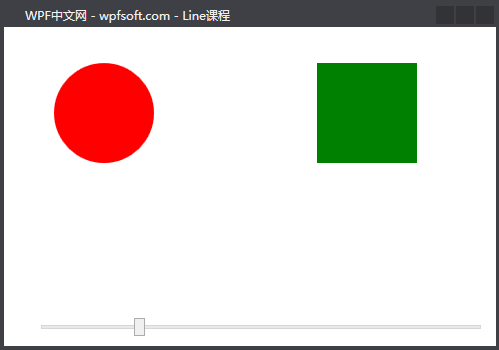
在本例中,我们实例化了两个Rectangle对象,如果RadiusX和RadiusY与Width、Height相等,则会显示一个正圆。
当前课程源码下载:(注明:本站所有源代码请按标题搜索)
文件名:080-《Rectangle矩形》-源代码
链接:https://pan.baidu.com/s/1yu-q4tUtl0poLVgmcMfgBA
提取码:wpff
——重庆教主 2023年10月18日
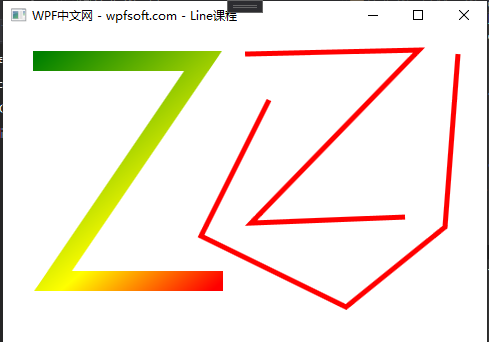
Polyline表示由一系列线段组合绘制而成的折线,因为它有一个Points属性,用来保存这些点的坐标。这些坐标点用于绘制Polyline图形中各线段相接处的顶点。集合中第一个元素表示起点,最后一元素表示终点。
在XAML前端代码中定义Points的内容书写格式如下:假如我们有4个点,分别是起点(30,30),中继点(200,30),中继点(50,250),终点(220,250),那么,Points的内容书写为:Points="30,30 200,30 50,250 220,250"
完整代码如下所示
<Canvas x:Name="canvas">
    <Polyline StrokeThickness="20"  Points="30,30 200,30 50,250 220,250">
        <Polyline.Stroke>
            <LinearGradientBrush StartPoint="30,30"
                                 EndPoint="220,250"
                                 MappingMode="Absolute">
                <GradientStop Color="Red" Offset="1" />
                <GradientStop Color="Yellow" Offset="0.66" />
                <GradientStop Color="Green" Offset="0" />
            </LinearGradientBrush>
        </Polyline.Stroke>
    </Polyline>
</Canvas>
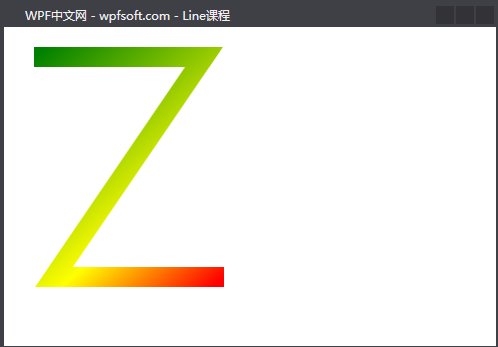
通过上述4个点的连接绘制,我们就绘制了一个"Z"字型的折线图形。
另外,我们也可以通过代码的形式像在画布上作画一样,通过捕获鼠标位置,每次单击就向Polyline中增加一个坐标点,从而达到绘制目的。
首先我们在Window窗体中增加下面两个事件的订阅。
PreviewMouseLeftButtonUp="Window_PreviewMouseLeftButtonUp"
PreviewMouseRightButtonUp="Window_PreviewMouseRightButtonUp"
然后,在第一次按下鼠标左键时,实例化一个Polyline,并在Points中增加当前鼠标的坐标,此后每按下一次鼠标就增加一个坐标点,直到用户单击鼠标右键为止。
public partial class MainWindow : Window
{
    public MainWindow()
    {
        InitializeComponent();
    }

    private int count = 0;
    private Polyline polyline = null;

    private void Window_PreviewMouseLeftButtonUp(object sender, MouseButtonEventArgs e)
    {
        if (count++ == 0)
        {
            polyline = new Polyline();
            polyline.StrokeThickness = 5;
            polyline.Stroke = Brushes.Red;
            canvas.Children.Add(polyline);
        }

        var point = e.GetPosition(canvas);
        polyline.Points.Add(point);
    }

    private void Window_PreviewMouseRightButtonUp(object sender, MouseButtonEventArgs e)
    {
        count = 0;
    }
}
最后,来看看效果
当前课程源码下载:(注明:本站所有源代码请按标题搜索)
文件名:081-《Polyline折线》-源代码
链接:https://pan.baidu.com/s/1yu-q4tUtl0poLVgmcMfgBA
提取码:wpff
——重庆教主 2023年10月19日
Polygon叫多边形,与Polyline类似,都有一个Points属性,只不过,Polygon会把起点和终点连接起来。就拿上一节的例子,我们只是简单地把Polyline换成Polygon,其它设置保持不变。如下所示:
<Canvas x:Name="canvas">
    <Polygon StrokeThickness="20"  Points="30,30 200,30 50,250 220,250">
        <Polygon.Stroke>
            <LinearGradientBrush StartPoint="30,30"
                                 EndPoint="220,250"
                                 MappingMode="Absolute">
                <GradientStop Color="Red" Offset="1" />
                <GradientStop Color="Yellow" Offset="0.66" />
                <GradientStop Color="Green" Offset="0" />
            </LinearGradientBrush>
        </Polygon.Stroke>
    </Polygon>
</Canvas>
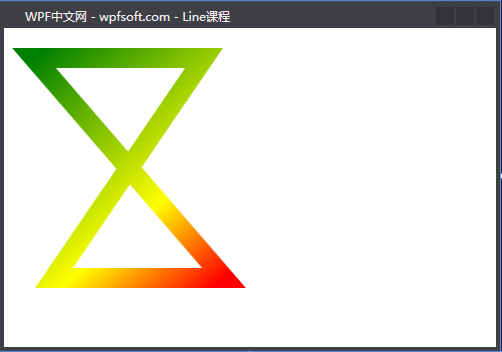
结果,在Polyline下面原本呈现的Z字形,在Polygon下面就变成了一个8字形,可以很明显的看到它的起点和终点相连起来了。
同理,我们在C#后端,也相应的修改成Polygon对象。
public partial class MainWindow : Window
{
    public MainWindow()
    {
        InitializeComponent();
    }

    private int count = 0;
    private Polygon polygon = null;

    private void Window_PreviewMouseLeftButtonUp(object sender, MouseButtonEventArgs e)
    {
        if (count++ == 0)
        {
            polygon = new Polygon();
            polygon.StrokeThickness = 5;
            polygon.Stroke = Brushes.Red;
            canvas.Children.Add(polygon);
        }

        var point = e.GetPosition(canvas);
        polygon.Points.Add(point);
    }

    private void Window_PreviewMouseRightButtonUp(object sender, MouseButtonEventArgs e)
    {
        count = 0;
    }
}
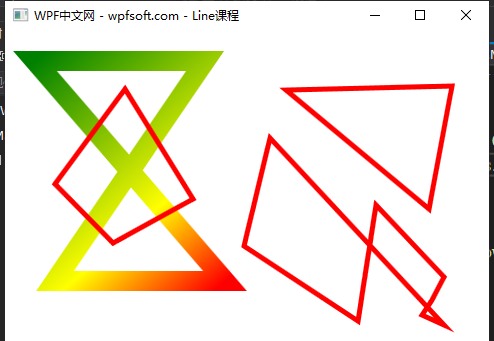
最后,效果如上,用鼠标绘制出来的就是封闭的多边形。
当前课程源码下载:(注明:本站所有源代码请按标题搜索)
文件名:082-《Polygon多边形》-源代码
链接:https://pan.baidu.com/s/1yu-q4tUtl0poLVgmcMfgBA
提取码:wpff
——重庆教主 2023年10月19日
public sealed class Path : Shape
{
    public static readonly DependencyProperty DataProperty;

    public Path();

    public Geometry Data { get; set; }

    protected override Geometry DefiningGeometry { get; }
}
从定义上看,Path只有一个Data属性,这个属性的类型为Geometry。而Geometry又是一个抽象类,所以我们不能直接使用它,那它肯定会有一系列可以实例化的子类。没错,Geometry表示一个几何,而几何的图形可以分为好几种。
| 几何名称 | 说明 |
| LineGeometry | 直线几何 |
| RectangleGeometry | 矩形几何 |
| EllipseGeometry | 椭圆几何 |
| PathGeometry | 路径几何 |
| StreamGeometry | PathGeometry的轻量级替代品,不支持 Bidning、动画等功能 |
| CombinedGeometry | 多图形组合,形成单一几何几何图形 |
| GeometryGroup | 多图形组合,形成几何图形组 |
接下来,我们分别讲一下这几种几何的用法。
一、LineGeometry直线几何
<Path Stroke="Blue" Fill="Red">
    <Path.Data>
        <LineGeometry  StartPoint="10,20" EndPoint="100,200"/>
    </Path.Data>
</Path>
二、RectangleGeometry矩形几何
<Path Stroke="Blue" Fill="Red">
    <Path.Data>
        <RectangleGeometry Rect="50,20,30,40" />
    </Path.Data>
</Path>
三、EllipseGeometry椭圆几何
<Path Stroke="Yellow" Fill="LightGreen">
    <Path.Data>
        <EllipseGeometry Center="150,80" RadiusX="60" RadiusY="50"/>
    </Path.Data>
</Path>
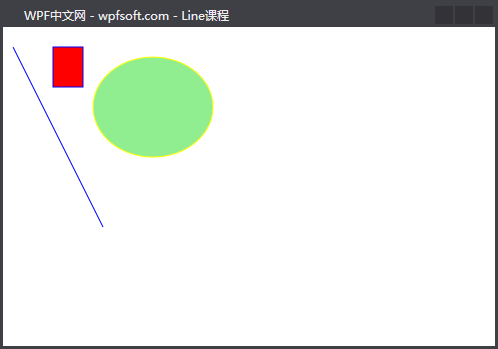
从上面的3个例子来看,Line、Rectangle、Ellipse控件能够画出来的效果,Path都可以画出来。而接下来我们要分享的是,Line、Rectangle、Ellipse控件画不出来的效果,Path也能画出来。那就是PathGeometry路径几何。
四、PathGeometry路径几何
PathGeometry微微有点复杂。它有一个Figures属性,可以容纳很多较复杂的图形。Figures是一个集合,其中的元素是PathFigure类型,而PathFigure中的Segments属性又是一个集合,其中的元素类型为PathSegment。
PathSegment是一个抽象类,我们可以实例化PathSegment的子类放到PathFigure中,然后把PathFigure放到PathGeometry中,这样就可以绘制不同的路径图形了。那么PathSegment有哪些子类呢?
| LineSegment | 直线段 |
| ArcSegment | 圆弧线段 |
| BezierSegment | 三次方贝塞尔曲线段 |
| QuadraticBezierSegmnt | 二次方贝塞尔曲线段 |
| PolyLineSegment | 折线段 |
| PolyBezierSegment | 多三次方贝塞尔曲线段 |
| PolyQuadraticBezierSegment | 多二次方贝塞尔曲 |
PathFigure有一个StartPoint属性表示起点坐标,而Segments集合中的元素就是上面那张表中的各种线段实例,它们将依次首尾相接,最终绘制成形。
我们以LineSegment和ArcSegment为例。
<Path Stroke="Black" Fill="LightPink" StrokeThickness="5">
    <Path.Data>
        <PathGeometry>
            <PathGeometry.Figures>
                <PathFigure StartPoint="150,200">
                    <LineSegment  Point="300,200"/>
                    <ArcSegment Point="300 50"
                                Size="100 100"
                                SweepDirection="Clockwise"
                                IsLargeArc="False"/>
                    <ArcSegment Point="300 200"
                                Size="100 100"
                                SweepDirection="Clockwise"
                                IsLargeArc="False"/>
                </PathFigure>
            </PathGeometry.Figures>
        </PathGeometry>
    </Path.Data>
</Path>
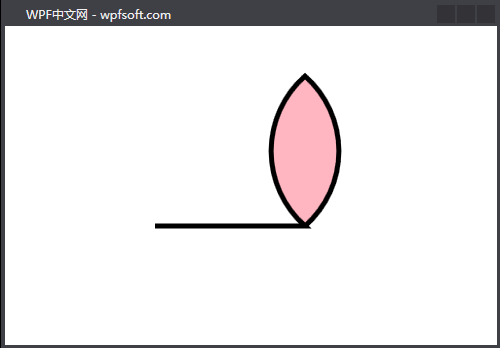
首先,PathFigure 图形的起点坐标为(150,200),然后第一个元素是线段,终点坐标为(300,200),图形的坐标原点是左上角(0,0),所以,往下就是Y轴正半轴方向,往右就是X轴正半轴方向。
然后,画了两条圆弧,第一条圆弧的起点坐标就是线段的终点坐标,即(300,200),圆弧的终点坐标为(300 50),大小为(100 100),第二条圆弧的终点坐标又回到了线段的终点坐标(300 200),于是就出现了图中的样子。
ArcSegment的常用属性如下:
Point:指明圆弧连接的终点;
Size:指明完整椭圆的横轴半径和纵轴半径;
IsLargeArc:指明是否使用大弧去连接 ;
SweepDirection :指明圆弧是顺时针方向还是逆时针方向;
RotationAngle:指明圆弧椭圆的旋转角度;
接下来,我们再讲一下BezierSegment贝塞尔曲线。
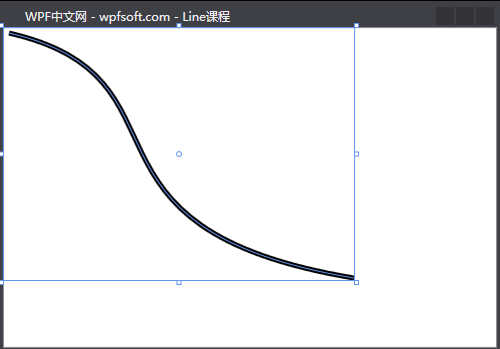
BezierSegment需要4个坐标点来完成图形的绘制,分别是起点,控制点1,控制点2和终点。
<PathFigure IsFilled="False" StartPoint="5,5">
    <BezierSegment Point1="200,50" Point2="50,200"  Point3="350,250"/>
</PathFigure>
如上所示,(5,5)表示起点(StartPoint属性),Point1属性(200,50)和Point2属性(50,200)表示两个控制点,Point3属性(350,250)表示终点。
五、Path的标记语法
通过上面的示例我们会发现要绘制复杂的图形,需要实例化各种子类,代码繁琐,这时就需要了解Path的路径标记语法,它大大减少了代码量。您可以从以下的表格或微软官网中获得相关知识。
| 命令 | 用途 | 语法 | 示例 | 对应标签语法 |
| M | 移动到起点坐标 | M 起点 | M 150,200 | <PathFigure StartPoint="150,200"> |
| L | 绘制直线 | L 终点 | L 300,200 | <LineSegment Point="300,200"/> |
| H | 水平直线 | H 终点横坐标 | ||
| V | 垂直直线 | V 终点横坐标 | ||
| A | 绘制圆弧 | A 母椭圆尺寸 旋转角度 是否大弧 顺时针/逆时针 终点 | A 180,80 45 1 1 150,150 | <ArcSegment Size="180,80" RotationAngle="45" IsLargeArc="True" SweepDirection="Clockwise" Point="150,150" /> |
| C | 三次方贝塞尔曲线 | C 控制点1 控制点2 终点 | C 200,50 50,200 350,250 | <BezierSegment Point1="200,50" Point2="50,200" Point3="350,250"/> |
| Q | 二次方贝塞尔曲线 | Q 控制点1 终点 | Q 200,50 350,250 | <QuadraticBezierSegmnt Point1="200,50" Point3="350,250"/> |
| S | 平滑三次方贝塞尔曲线 | S 控制点2 终点 | S 200,50 350,250 | |
| T | 平滑二次方贝塞尔曲线 | T 终点 | T 350,250 | |
| Z | 闭合图形 | Z | M 10,150 L40,150 L40,250 L10,250 Z | <Path Fill="HotPink" Data="M 10,150 L40,150 L40,250 L10,250 Z" /> |
<Path Fill="HotPink" Data="M 10,150 L40,150 L40,250 L10,250 Z"/>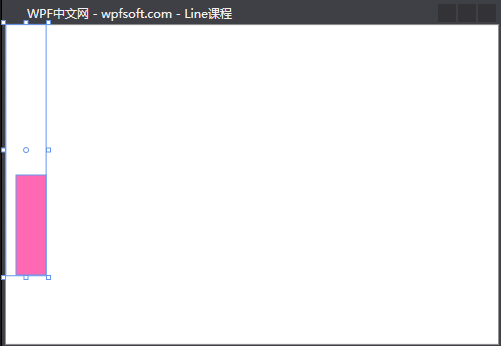
最后,我们通过Path的路径标记语法画了一个封闭的矩形图形,可以看到代码量的书写大大减少了。
当前课程源码下载:(注明:本站所有源代码请按标题搜索)
文件名:082-《Path路径》-源代码
链接:https://pan.baidu.com/s/1yu-q4tUtl0poLVgmcMfgBA
提取码:wpff
——重庆教主 2023年10月20日
 WPF中文网